Accounting Ratios to Use in Your Small Business or Nonprofit
Every small business should have a solid accounting or bookkeeping method implemented in order to be successful. The next step in utilizing your well-organized accounting for success is to use the numbers for performance measurement. While reports of different kinds can lend themselves insightful to seeing your business’s operational efficiency and effectiveness, there are other ways to see specifically where your business stands financially. One such way is through the use of financial ratios, which help make sense of your accounting information. Ratios are useful for comparing your current performance to your past performance or to another business within your industry. They are also useful for identifying strengths/gains and weaknesses within your small business.
The following ratios are key ratios for small business owners in seeing how their operations stack up and where improvement can be made:
1. Common Size Ratio – To see how much something is of the total
Financial statements provide the big picture of your small business’s finances, but to really dive into how your business is performing, seeing how each account relates to that big picture is important. This is what the Common Size Ratio does, by taking an individual account and seeing what percentage that account is of the total.
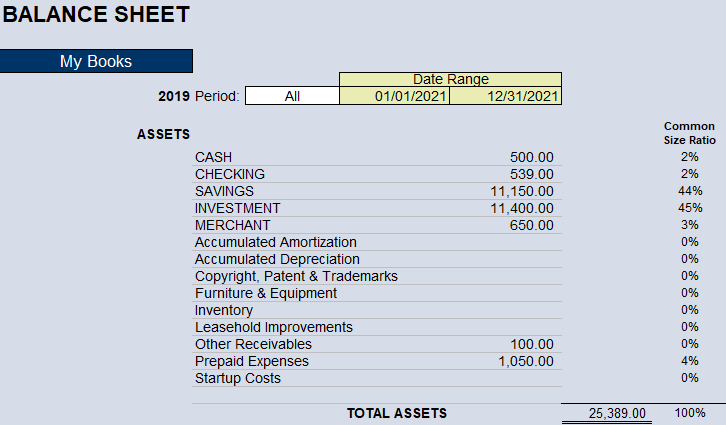
For example, let’s say we are looking at how much our Savings Account makes up our Total Assets.
We would take our Savings Account divided by our Total Assets and multiply it by 100 to obtain the percentage that the Savings Account is of Total Assets. Now let’s add some numbers to get a good picture of how this could be useful.
As shown above in the balance sheet generated in Big E-Z Accounting Software for Google Sheets Add-on, our Savings Account of $11,150 makes up 44% of Total Assets of $25,389. Comparing this information to prior years and to others within the industry can prove useful in seeing where your small business stands in relation to itself or to its competitors from an account level on any account on the balance sheet or income statement.
2. Current Ratio – To see how your business can meet its current debt with its current resources
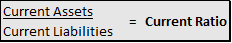
This ratio is meant to show you as a small business owner your current financial situation. Calculating current assets against current liabilities can show you what your business has in assets against what it owes, with a ratio higher than 1 being ideal. For every $1 of current debt, how many dollars of current assets do you have to cover your debt in case of emergency? This ratio is calculated as follows:
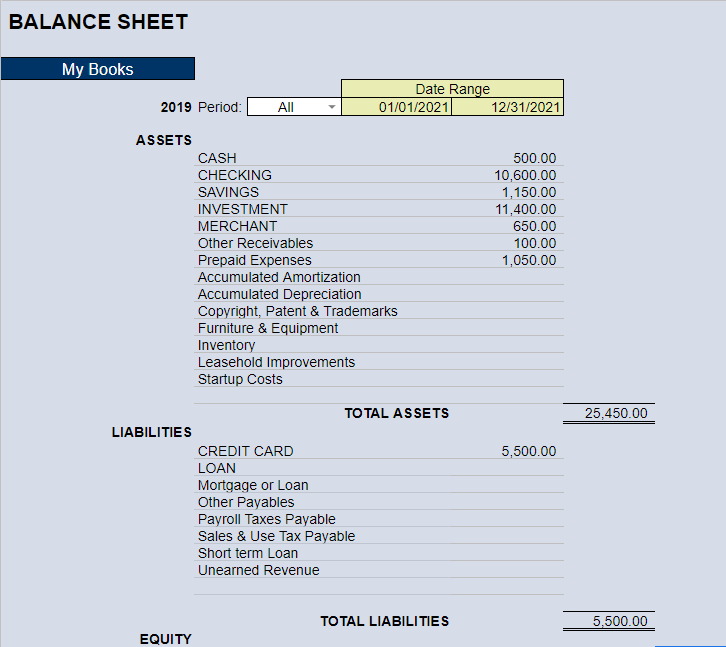
In the example above generated by Big E-Z Accounting Software for Google Sheets Add-on, current assets consist of the following accounts: Cash, Checking, Merchant, Other Receivables, Inventory, and Prepaid Expenses. Using Big E-Z’s data, the current ratio of this sample company is calculated below:
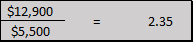
Ideally, a ratio of 2-1 would be a healthy position for your small business to be in, as that would indicate that you have twice as many current assets as current liabilities. In the example generated by the data provided by Big E-Z Accounting Software for Google Sheets Add-on, the current ratio for the sample company is 2.35, which indicates that for every dollar of debt that the company owes, they have $2.35 in assets to cover their debt, which is an extremely healthy position for a company to be in. The use of this ratio can bring insight as to how your current financial position compares to your past financial position. Additionally, you can also compare this ratio against your industry’s standard to see where your small business stands in accordance.
3. Quick Ratio – To look deeper into your company’s financial position
Similar to the current ratio, the quick ratio looks to see if your small business would be able to meet its current financial obligations with what it has, in case something was to happen to your business. However, this ratio gives a better picture of this by only including current assets that are easily converted to cash (liquidatable). This ratio is shown below:
A healthy quick ratio is 1.0 or more, which means that for every dollar of debt you have, you should have at least one dollar of assets that can quickly be converted to cash to cover the debt. In the example generated by the data provided by Big E-Z Accounting for Google Sheets Add-on, the current ratio is 2.01, which indicates that for every dollar of debt that the sample company owes, they have $2.01 of assets that can easily and quickly be converted to cash, in the case of an emergency. The use of this ratio would be the same as to why you should use the current ratio, only more narrowed in on the urgency factor.
4. Net Profit Margin – To determine how profitable your business really is
There are several ratios that can be used to look at the profitability of your small business, but perhaps one of the most helpful ratios is the Net Profit Margin ratio, which takes into account all expenses that are incurred within a given period and shows your overall net income as a percentage of total revenues within the same period. This ratio is demonstrated below:
Now let’s add some numbers and see the results of this ratio and what insight it can give:
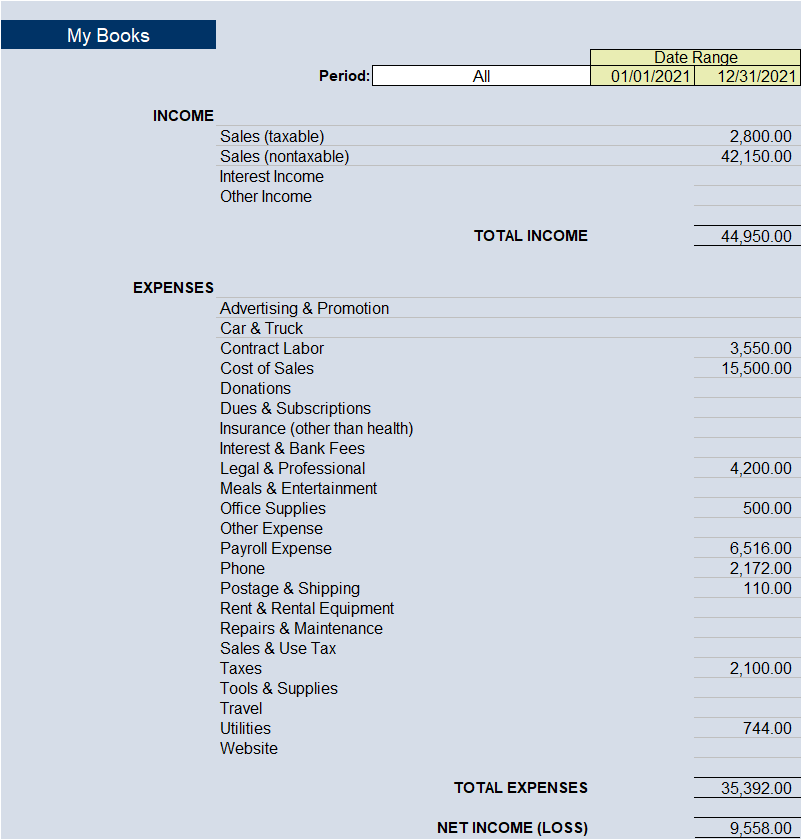
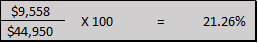
In the example in this Income Statement generated by Big E-Z Accounting for Google Sheets Add-on, we can see that net income is derived from subtracting all expenses from revenue/income. Sales of $44,950 are recorded and total expenses of $35,392 are recorded. The net profit margin of this particular Income Statement data is shown below:
Net profit margin is one of the most important indicators of a company’s financial health. It helps management decide whether enough profit is being generated from its company’s sales and also whether operating and overhead costs are being contained. In the example generated by the data provided by Big E-Z Accounting for Google Sheets Add-on, after all the expenses have been accounted for, the overall profitability of the sample company is 21.26% of total revenue, which is a relatively high profit margin, though the industry in which your company is in can dictate an ideal profit margin.
Here are a few more important comparisons to make
Comparing your current year to your prior year is very important. You’ll want to make note of any increase or decrease in income or expense balances. It should make sense to you. For example, a big decrease in sales might mean something was classified incorrectly.
Another ratio you might use is Gross Profit Percent. You would take Sales – Cost of Goods Sold = Gross Profit
And don’t forget to look at all profit and loss items as a percent of sales. For example, Salaries & Wages / Sales, then compare to prior periods or industry average.